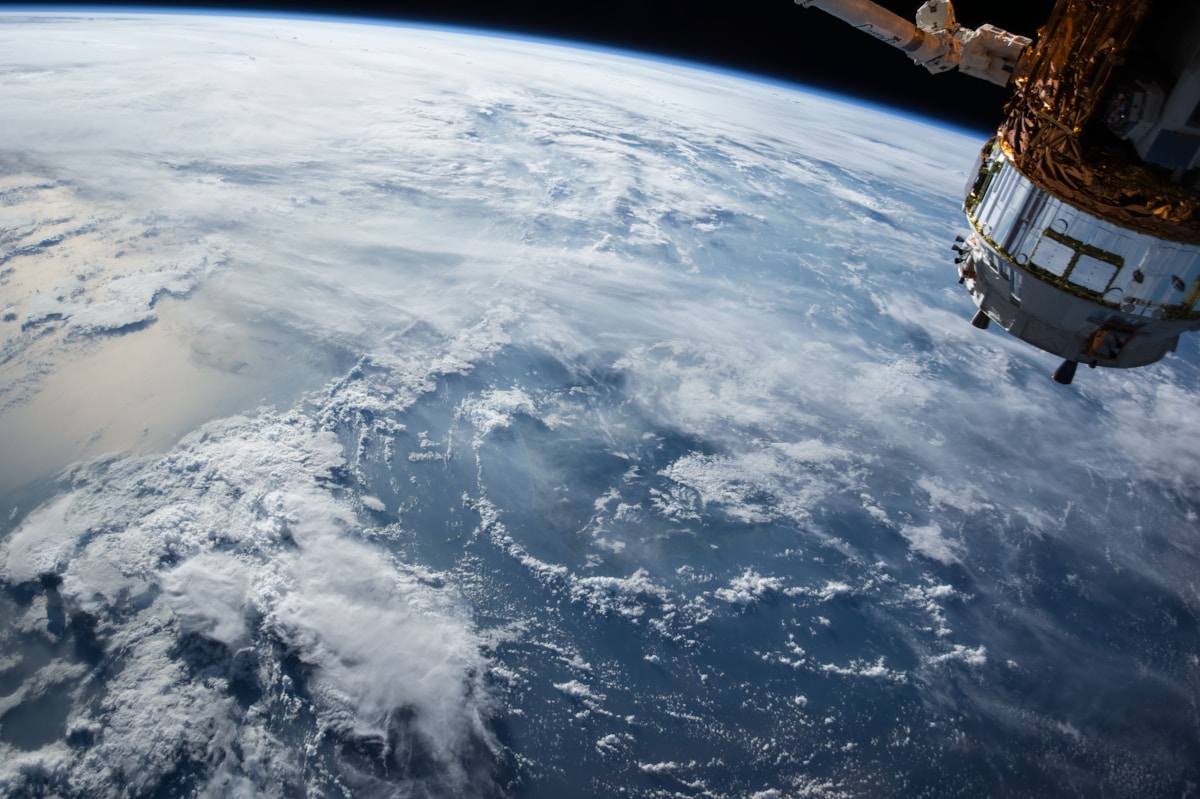
Free LiDAR Data Sources: Where to Download Point Clouds Without Paying
LiDAR point clouds power elevation models, forestry and 3D mapping, and much of it is free. This guide lists the best open sources and how to use them in QGIS.
69 stories published in November 2026
LiDAR point clouds power elevation models, forestry and 3D mapping, and much of it is free. This guide lists the best open sources and how to use them in QGIS.
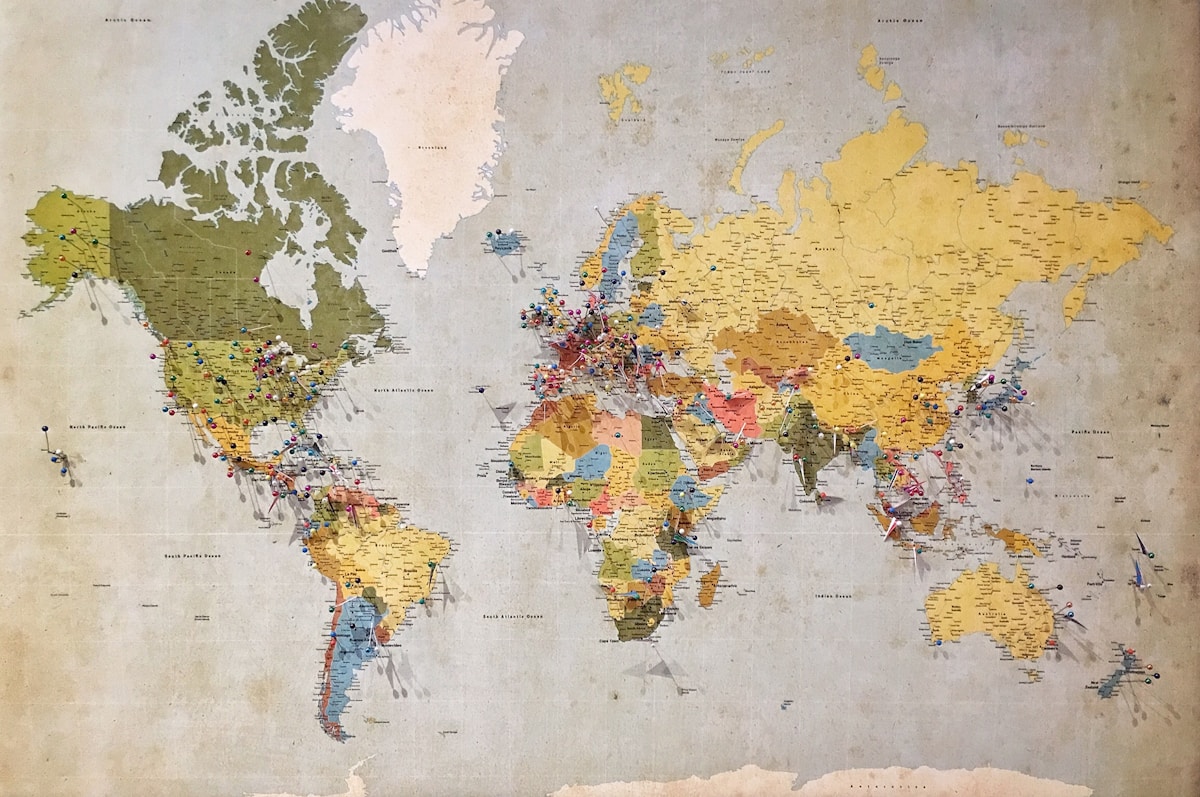
Every GIS layer sits in a coordinate system, and mismatches cause layers to misalign. This beginner guide explains datums, projections and on-the-fly reprojection.

Pix4D is the accuracy benchmark, DroneDeploy is the easiest all-in-one platform, and Agisoft Metashape is the best one-time purchase. Here is how the three leading drone mapping tools compare on price, accuracy and workflow in 2026.
QGIS 4.0 arrived in February 2026 with a Qt6 migration, a 3D globe view and a wave of plugin changes. Here is what is actually new, what breaks, and whether you should upgrade now or stay on the 3.44 long-term release.

Raw LiDAR data is just a cloud of points. Classification turns it into ground, buildings and vegetation, and QGIS has the tools to do it free. Here is a practical workflow from download to classified cloud.

The QGIS Raster Calculator turns ordinary bands into custom indices, masks and classifications. Learn the syntax, the common band combinations, and how to build your own index from scratch.

If you run the same five QGIS tools on every new dataset, you are doing it by hand for no reason. The Graphical Modeler chains those tools into one reusable workflow, no Python required.
Collecting data in the field is where GIS meets the real world. QField, Mergin Maps and ArcGIS Field Maps are the three leading apps in 2026, and the right choice depends on your software, your budget and your team.

A viewshed shows exactly which ground is visible from a viewpoint, and it is essential for siting towers, turbines and scenic overlooks. Here is how to run one in QGIS with a free elevation model.

The Copernicus Browser is the free front door to Sentinel-2 imagery, 10-metre resolution refreshed every few days. Here is how to search, preview and download a scene without paying or installing anything.
Routing turns a road map into answers: the shortest path, the nearest facility, the area reachable in ten minutes. Here is how to build a routing network in QGIS from OpenStreetMap data.
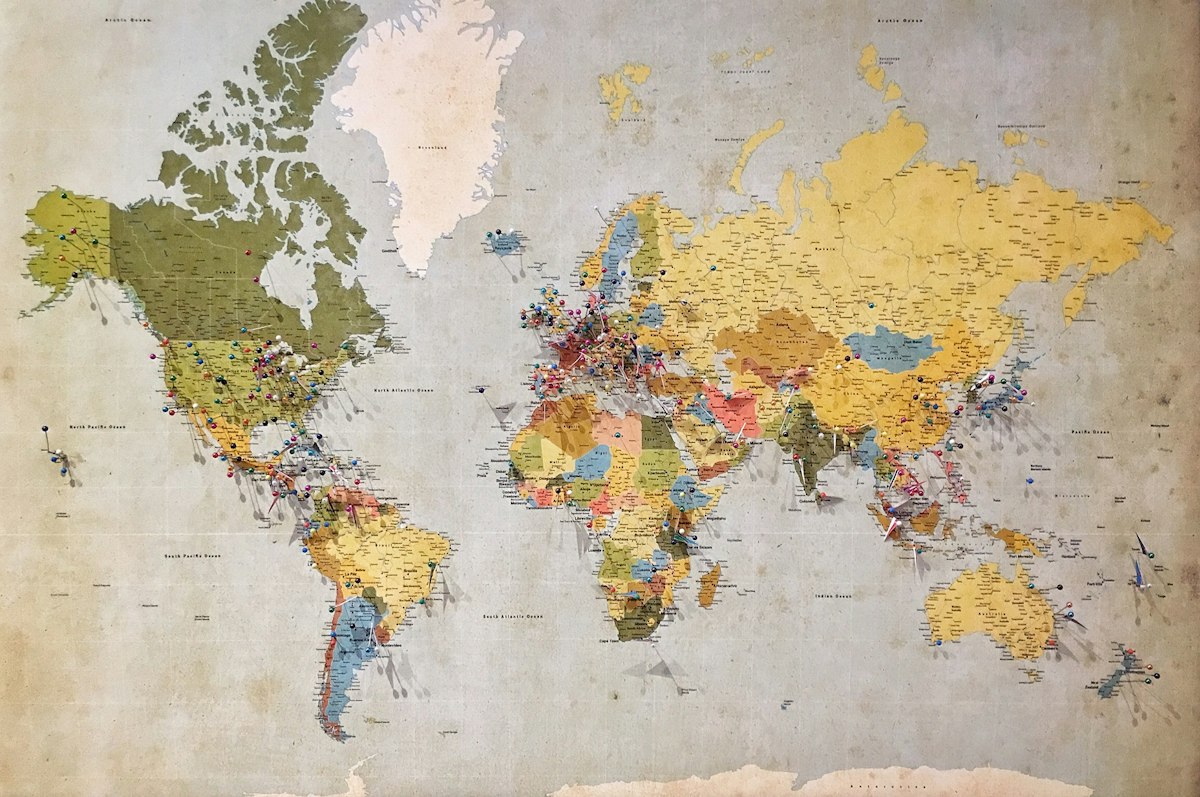
Satellite imagery and elevation data usually arrive as separate tiles. Mosaicking merges them into one seamless raster in QGIS, and the difference between a clean result and a mess of seams comes down to matching CRS, resolution and nodata values first.

A hillshade turns a flat elevation raster into a shaded relief map that makes valleys, ridges and slopes instantly readable. With a free DEM from SRTM or Copernicus and QGIS's built-in tool, it takes about five minutes.

Digitizing turns what you see on a satellite image into proper map data: points for wells, lines for roads, polygons for fields. This guide covers creating layers, snapping, tracing and the habits that keep your data clean.

A shapefile knows where things are, but a spreadsheet knows what they are. Joining a CSV to a shapefile on a shared key brings the two together, and the whole trick is making sure the key matches exactly on both sides.

A time series of satellite images shows change far better than any single map. QGIS's Temporal Controller turns dated layers into an animation, so urban growth, receding water or spreading fire becomes a moving story instead of a static picture.
NDVI is the default vegetation index, but it saturates over dense canopy and struggles with haze. EVI adds a blue band and correction coefficients to fix exactly those weaknesses. Here is how the two compare, when each wins, and how to calculate both in QGIS.
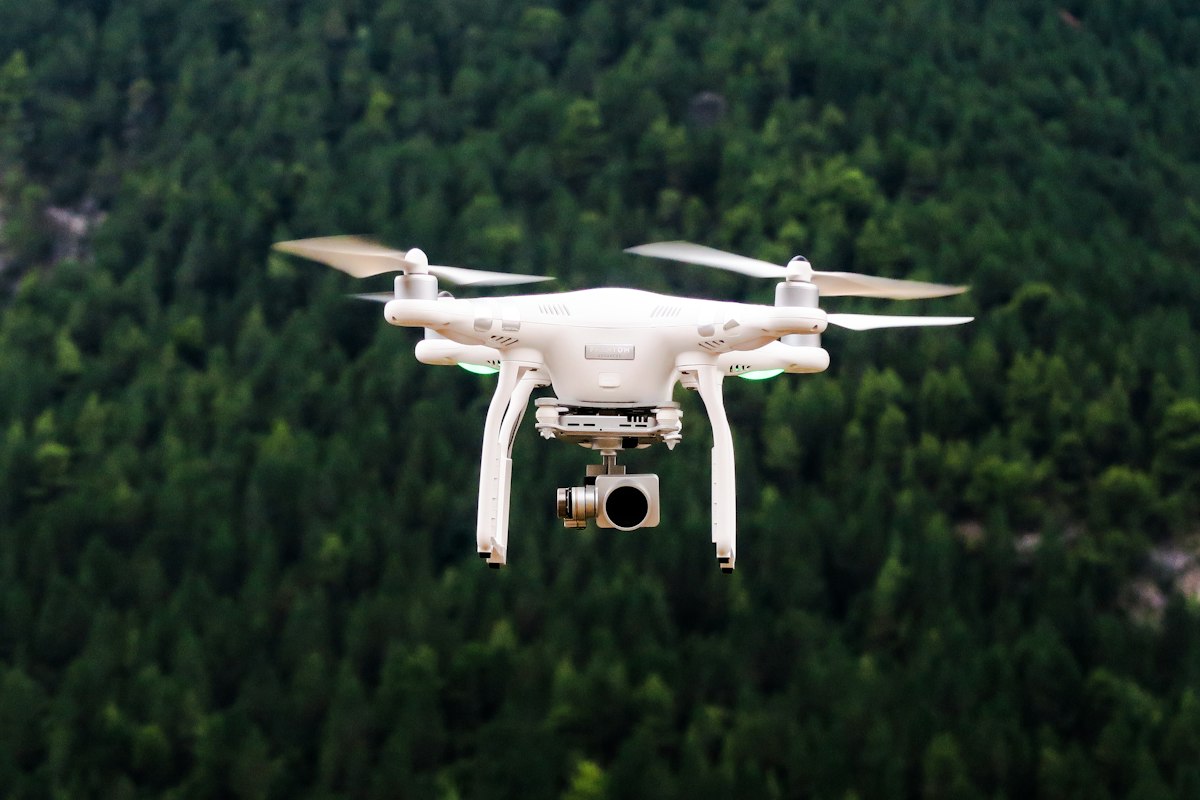
Without ground control points, a drone map can be metres off its true position. Five well-placed GCPs are enough for most jobs, but placement matters more than count: corners, one in the centre, and a few held back as checkpoints.
Google Earth Pro has a free measuring tool that handles distances, paths and areas without any GIS software. This guide shows where the tool lives, how to trace a boundary, and how to read the results in the units you actually want.
QGIS2Web turns a QGIS project into a working web map you can host for free, with layers, popups and a search box. This guide covers preparing the project, choosing Leaflet or OpenLayers, and putting the result on GitHub Pages.
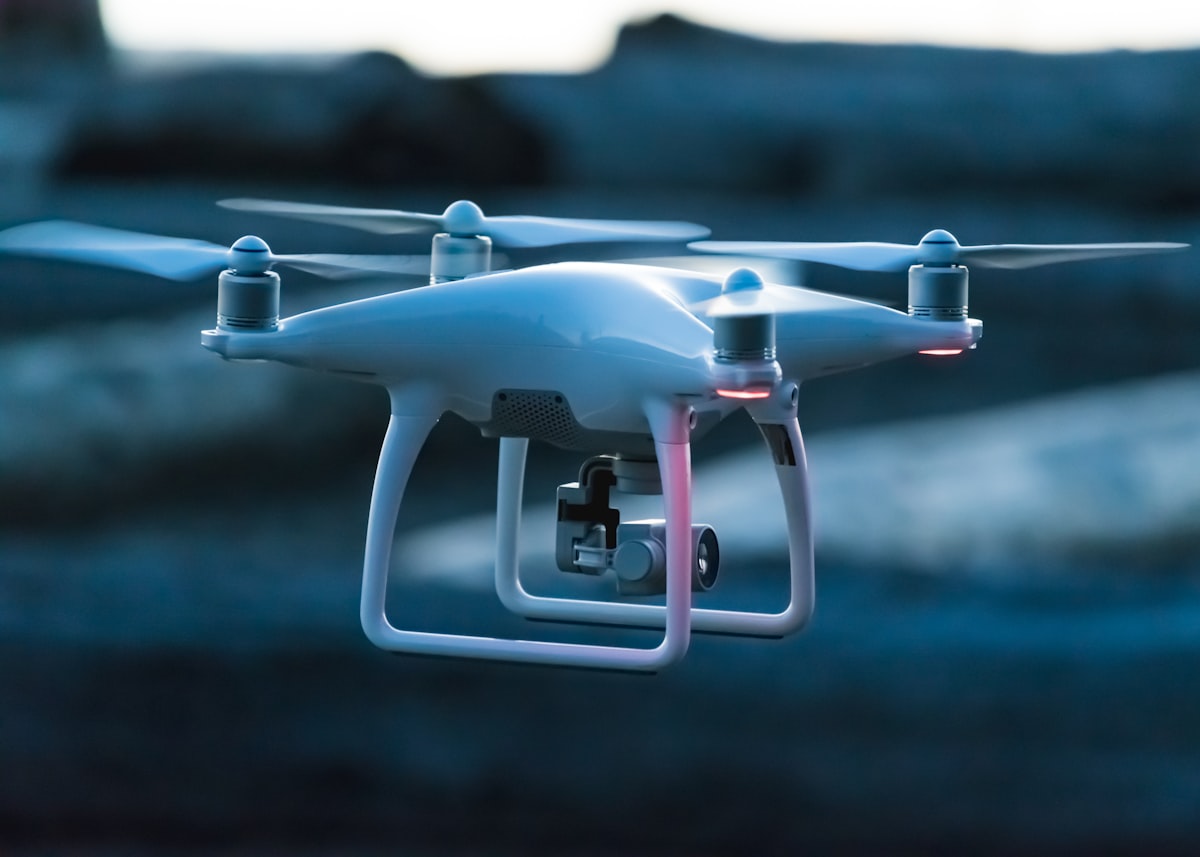
A mapping drone is an aircraft, and flying one comes with legal duties that have nothing to do with the camera. Registration, airspace rules, privacy and insurance differ by country, but the checklist below covers the questions every beginner should answer before takeoff.