Satélites da NASA observam o histórico El Niño de 2026
Story summary
Um fenômeno mais raro que um eclipse solar e mais poderoso que qualquer sistema de tempestade está se desenrolando neste outono, e a NASA está acompanhando-o de perto. El Niño é um padrão climático natural que surge aproximadamente a cada dois a sete anos, marcado por temperaturas da água mais quentes do que o normal em partes do Equador
📌 Key Highlights & Takeaways
- Um fenômeno mais raro que um eclipse solar e mais poderoso que qualquer sistema de tempestade está se desenrolando neste outono, e a NASA está acompanhando-o de perto.
- El Niño é um padrão climático natural que surge aproximadamente a cada dois a sete anos, marcado por temperaturas da água mais quentes do que o normal em partes do Equador
A phenomenon rarer than a solar eclipse and more powerful than any single storm system is unfolding this fall, and NASA is tracking it closely.
El Niño is a natural climate pattern that emerges roughly every two to seven years marked by warmer-than-normal water temperatures in parts of the equatorial Pacific. NASA scientists are keeping watch as it flips trade winds, redistributes ocean heat, scrambles rain patterns, and raises sea surface height across parts of the Pacific.
As of October, the National Oceanic and Atmospheric Administration (NOAA) has said that there’s an 83% chance that the strongest El Niño since 1950 is currently unfolding. People around the world, including farmers, firefighters, and coastal communities, are already experiencing the effects in different ways.
Follow along with these maps as NASA tracks El Niño from its epicenter in the equatorial Pacific Ocean.
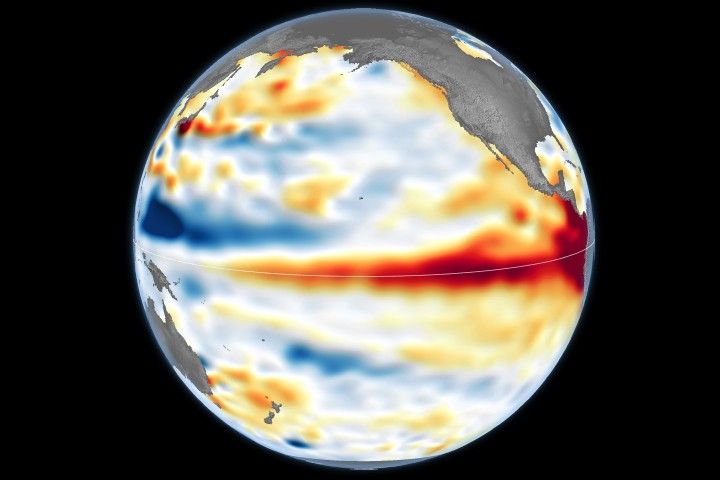
One of the first clues appeared in satellite imagery in January 2026, when a swell of warm water called a Kelvin wave was spotted near Micronesia in the western Pacific. Kelvin waves are slow-moving pulses of water thousands of miles long. Like underwater freeways, they transfer heat from west to east across the Pacific. The warm water heats the air directly above it, making it rise. The change in air pressures weakens or even reverses the trade winds that typically blow in the opposing direction, from the Americas toward Asia, causing sea levels in the eastern Pacific to rise further, and waters to warm even more. This chain reaction signifies the start of an El Niño.
The map above shows that by early April, those Kelvin waves had reached the eastern Pacific, and sea surface temperatures had begun to warm. Warm water expands in volume, elevating local sea levels in some areas by as much as 1 to 1.3 feet (30 to 40 centimeters). The higher-than-normal water can be seen sloshing toward South America then moving up the coast to California. Sea levels that are six to eight inches (15 to 20 centimeters) lower than normal are visible around Indonesia and northern Australia.
“Kelvin waves are like the heartbeat of El Niño,” said Josh Willis, project scientist for sea level missions at NASA’s Jet Propulsion Laboratory in Southern California. “And our sea level satellites let us peer into the ocean and watch every beat.”
Scientists have used satellite altimetry to track the height of the ocean with ultraprecision since 1993. That unbroken data record continues today with the Sentinel-6 satellites . State-of-the-art radar altimeters aboard these satellites survey millions of square miles of ocean in a single day, complementing NOAA’s fleet of ocean sensors and buoys drifting and diving through the water below.
Cryptographic Security & Key Generator
Generate entropy-tested high-security keys and encryption-grade tokens.
Source: NASA.
Read the full story at the original source ↗
For questions: mrsmithcons@gmail.com.
❓ Frequently Asked Questions (Satellite Datasets Briefing)
What orbital telemetry or sensor data corroborates this Satellite Datasets discovery?
Multi-spectral satellite imagery, radar altimetry, and space agency observational feeds provide calibrated observational data confirming the parameters of this event.
How does this observation impact current aerospace and geospatial modeling?
The recorded metrics refine atmospheric correction algorithms and orbital ephemeris models, enabling higher resolution tracking and trajectory accuracy.
When is the next telemetry downlink or public briefing scheduled?
Real-time space agency mission updates and satellite overpass data are ingested continuously through FreeSky GeoData tracking desks.
🗺️ Complete Satellite Dataset Pack & Processing Scripts
Geotiff files, QGIS project templates, and Python raster analysis scripts.
⚡ Download Geo Pack ➔More from FreeSky GeoData

From Animation to Reality: See Starship Deploy Satellites in Orbit
What was once just an animation is now a breathtaking reality. This epic video shows SpaceX's Starship success...
 🤖 WinBar AI
Najděte nejlepší Smart Betting AI 2026
Cobertura de última hora relatada pela Universidade de Córdoba (UCO): Najděte nejlepší Smart Betting AI 2026. ...
 ☁️ FreeSky Cloud
Hyperscaler Cloud Growth Is Accelerating Again: What Q3 2026 Means for Enterprise Buyers
A new Goldman Sachs report shows combined hyperscaler cloud growth jumping from 24% to 48%, with nearly $1.7 t...
 🛰️ FreeSky Aerial
NASA realizará voos de baixa altitude sobre terras agrícolas do Texas
Uma aeronave Dynamic Aviation A200 da NASA realizará voos de pesquisa de baixa altitude sobre terras agrícolas...