How to Create a Slope and Terrain Map from a Free DEM in QGIS
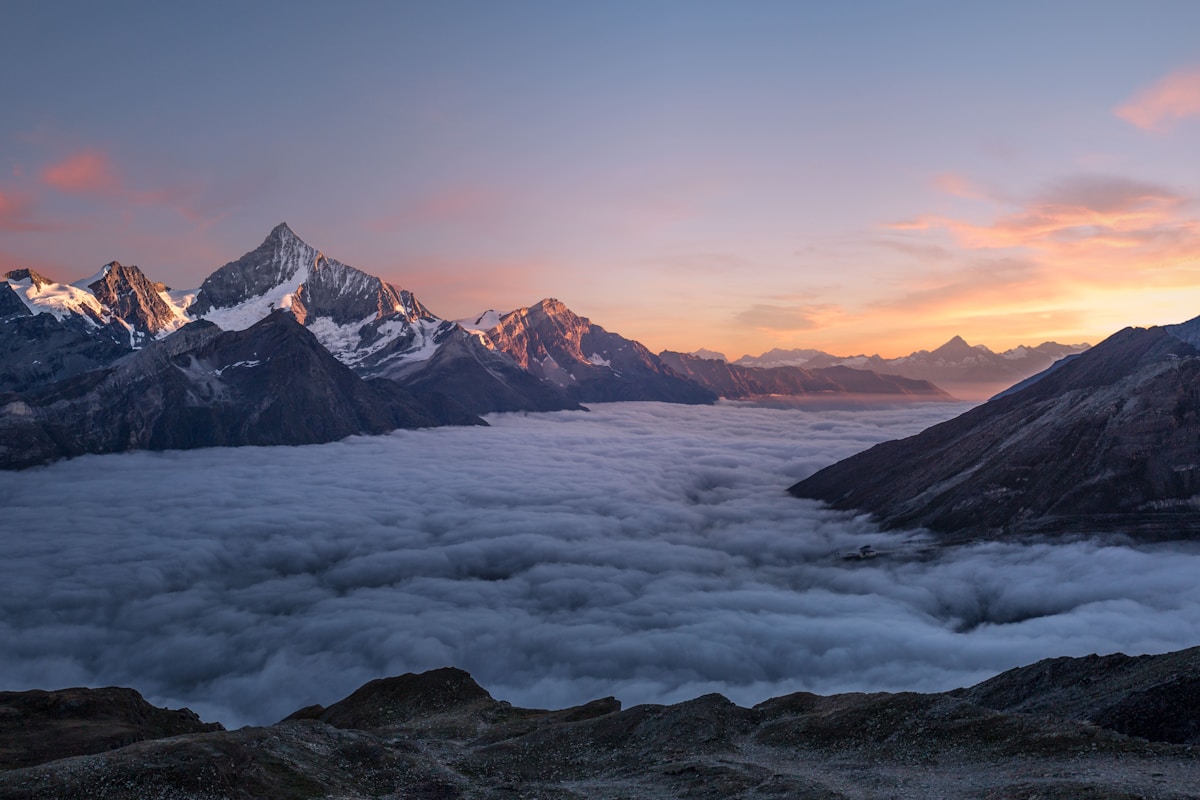
- Primary Signal: How to Create a Slope and Terrain Map from a Free DEM in QGIS
- Overview: Turn a free SRTM or Copernicus DEM into slope, aspect, hillshade and contour maps in QGIS, with class thresholds, a worked slope example, and validation checks....
- Verification: Analyzed and compiled by FreeSky GeoData editorial monitoring desk.
A digital elevation model, or DEM, is a raster where every pixel stores height above sea level instead of colour. From that single layer you can derive slope, aspect, hillshade, contours and watershed boundaries, turning a flat elevation download into terrain intelligence for farming, construction, hiking routes and flood-aware planning. The most accessible global DEMs are SRTM at 30 metres, ALOS PALSAR at 30 metres, and Copernicus GLO-30 at 30 metres, all free for most uses and all usable in QGIS without specialist software.
Start by downloading a DEM for your area from OpenTopography, EarthExplorer or the Copernicus Data Space, then clip it to your study boundary to keep processing fast. A province-sized SRTM tile may contain 12 million pixels; clipping to a 20 by 20 kilometre district cuts that to under half a million and makes every later tool run in seconds rather than minutes. Check for voids and spikes first: SRTM contains no-data holes in steep mountains and radar shadow, which appear as black pits, and a single erroneous pixel of 9,999 metres will corrupt every slope calculation downstream. Fill small voids with the Fill NoData tool or replace the tile with a newer Copernicus DEM for that area.
Hillshade deserves a second look, because a single hillshade direction can hide valleys that run parallel to the light. Generate a second hillshade at 135 degrees azimuth and compare the two, or use a multidirectional hillshade where QGIS or GDAL blends several light directions into one softer relief. For printed maps, place hillshade beneath a semi-transparent slope layer at 40 percent opacity, so steep areas darken naturally while flat plains stay bright. Test the print in greyscale too, because a map that only reads in colour will fail when photocopied for field teams, and field teams are often the people who need terrain maps most.
📖 Continue Reading the Full Story
Continue reading this article on FreeSky GeoData.
⚡ Access Full Content NowMore from FreeSky GeoData


 🤖 WinBar AI
AI Image Generator: Create Art From Text Free
Generate stunning images from text descriptions with free AI. No design skills needed — describe it, get it....
 ☁️ FreeSky Cloud
Comparative Review: Freelancer Net Pay Calculator (PKR) — Upwork, Fiverr & Payoneer Fees (Day 11 Guide)
Why our free online Freelancer Net Pay Calculator (PKR) — Upwork, Fiverr & Payoneer Fees on FreeSky Cloud. Dis...
 🛰️ FreeSky Aerial
Troubleshooting Guide: Freelancer Net Pay Calculator (PKR) — Upwork, Fiverr & Payoneer Fees (Day 12 Guide)
Diagnosing hidden issues using the Freelancer Net Pay Calculator (PKR) — Upwork, Fiverr & Payoneer Fees on Fre...
 🔭 FreeSky Cosmos
Pro Tips & Tricks: Freelancer Net Pay Calculator (PKR) — Upwork, Fiverr & Payoneer Fees (Day 13 Guide)
How professionals get 10x value from the Freelancer Net Pay Calculator (PKR) — Upwork, Fiverr & Payoneer Fees ...