NDVI Explained for Farmers: Reading Crop Health From Satellite Data
- Primary Signal: NDVI Explained for Farmers: Reading Crop Health From Satellite Data
- Overview: NDVI turns satellite images into a simple crop-health signal, but it is easy to misread. This guide explains what NDVI actually measures, how farmers use it, and where it misleads....
- Verification: Analyzed and compiled by FreeSky GeoData editorial monitoring desk.
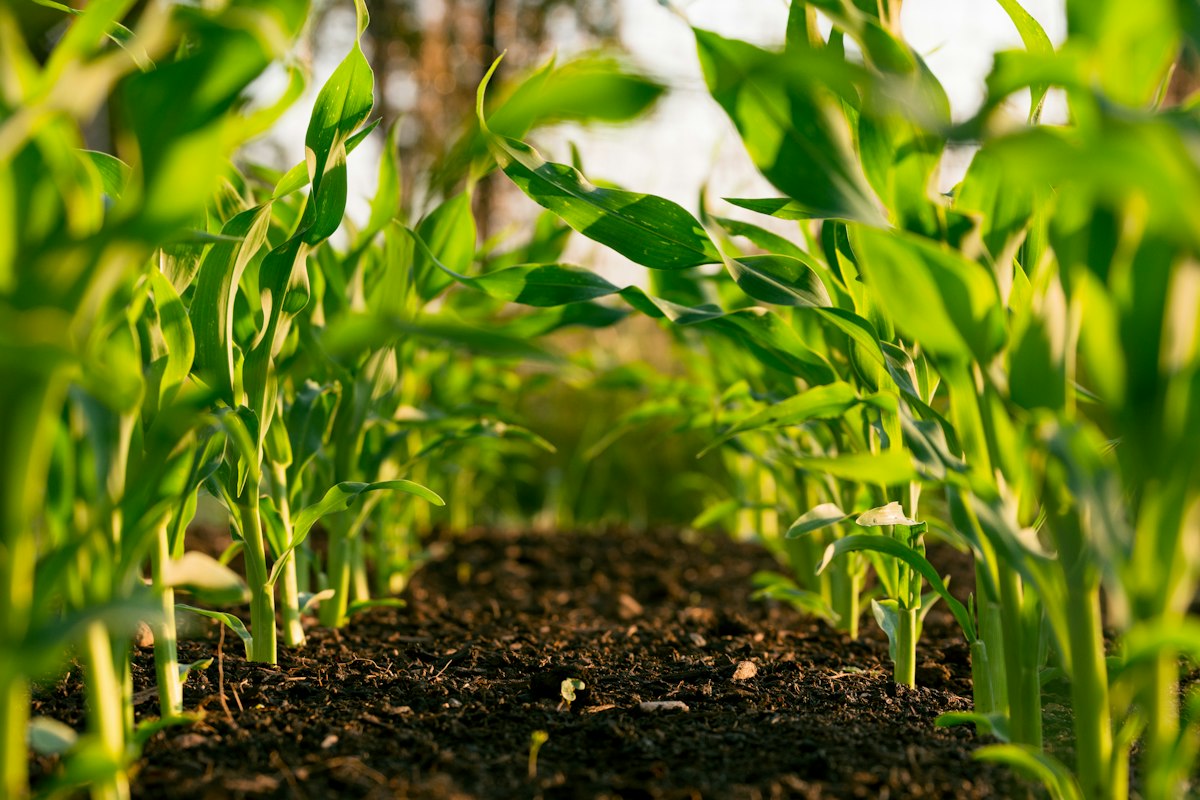
Farmers have always read their crops by eye, walking fields to spot yellowing, thinning, or pest damage. Satellite vegetation indices let you do the same job across hundreds of acres at once, and NDVI, the Normalised Difference Vegetation Index, is the most widely used. It distils satellite measurements into a single number per pixel that reflects how vigorous the vegetation is, and it is free to compute from Sentinel-2 and Landsat data. Understanding what that number means, and what it does not, is the difference between a useful tool and a misleading one.
NDVI works because healthy green leaves reflect near-infrared light strongly while absorbing red light for photosynthesis. The index compares those two measurements on a scale from minus one to plus one: dense healthy vegetation scores roughly 0.6 to 0.9, stressed or sparse vegetation lower, bare soil near zero, and water negative. It is a measure of greenness and canopy density, not a direct measure of yield, nitrogen, or disease, and keeping that distinction in mind prevents most misinterpretations.
The most practical use is spotting variability within a field. An NDVI map from a free Sentinel-2 image, updated every few days, reveals patches that are lagging behind the rest of the crop, and those patches become the first places to scout on foot. Often the cause is obvious on the ground, a blocked irrigation line, a low spot holding water, a sprayer miss, or pest pressure, and the satellite simply told you where to look instead of walking the whole field.
NDVI saturates in dense canopies: once leaf cover is complete, the index stops rising even as biomass keeps growing, so it cannot distinguish a good crop from a great one late in the season. Bare soil background distorts readings in sparse crops, making a thin stand look worse than it is, and different crop types and growth stages have different healthy baselines, so a single threshold never fits all fields. Clouds and shadows corrupt individual images, which is why composites and time series beat single snapshots.
Start with the Copernicus Browser or a free farm platform that already computes NDVI from Sentinel-2, so you can see your own fields without processing raw data. Compare images from the same sensor across the season, note the dates, and keep simple records of what you found on the ground at each flagged patch. Over one season you will learn your fields' normal patterns, which is when NDVI becomes genuinely useful rather than merely interesting.
📖 Continue Reading the Full Story
Continue reading this article on FreeSky GeoData.
⚡ Access Full Content NowMore from FreeSky GeoData


 🤖 WinBar AI
Why Do Bookmakers Limit Winning Accounts? The Business Logic Explained
Getting limited after winning is frustrating, but it follows a clear business logic. Here is why soft bookmake...
 🛰️ FreeSky Aerial
How Do Pilots Land Planes in Thick Fog? Autoland Explained
When pilots can't see the runway, the autopilot takes over. Here's how ILS beams and autoland systems guide ai...
 ⚡ CyberTech 568
Best Free AI Voice Changer for Gaming in 2026
A good voice changer adds fun to game night without lag or robotic audio. Compare the best free options for Di...
 ☁️ FreeSky Cloud
Best Free Tier Cloud Hosting 2026: Host Projects Without Paying
Compare the best free tier cloud hosting options for 2026, including what is genuinely free, what limits apply...