Free Satellite Imagery for Agriculture Monitoring: Track Crops Without Paying for Data
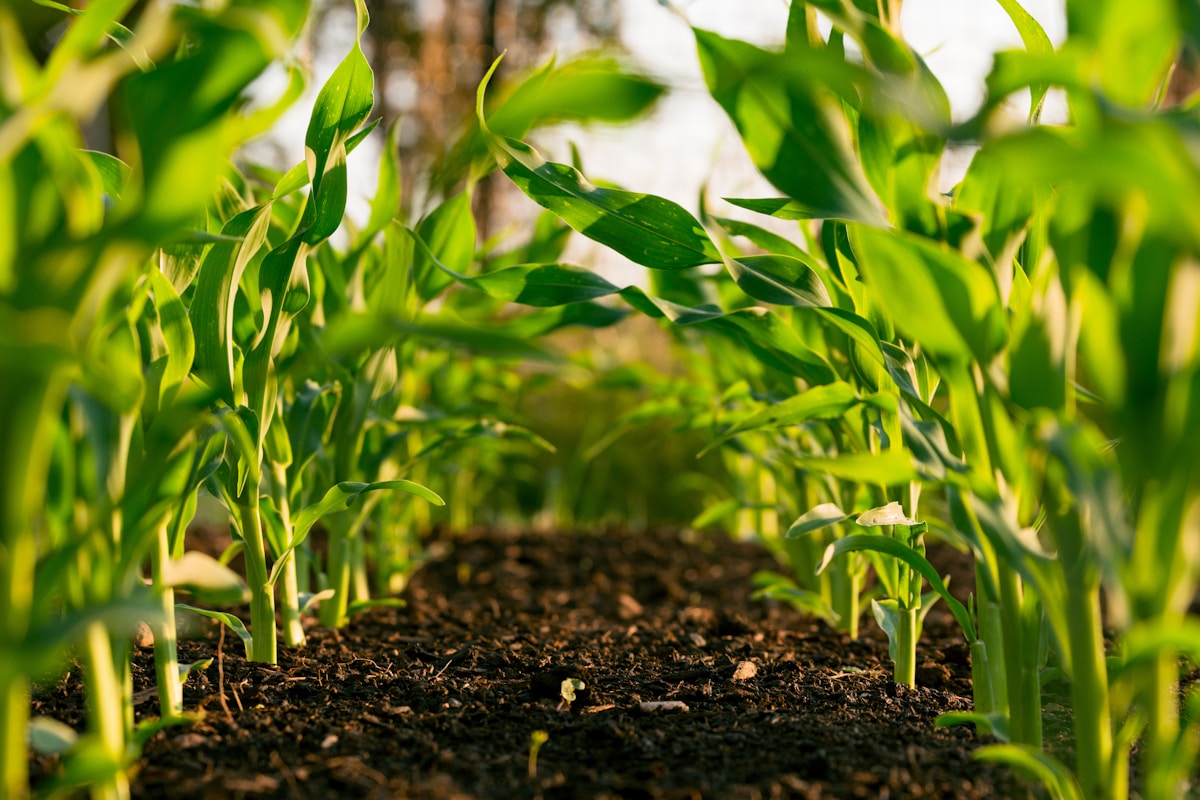
- Primary Signal: Free Satellite Imagery for Agriculture Monitoring: Track Crops Without Paying for Data
- Overview: Farmers and researchers can now watch crop health from space for free. Open satellite programmes provide regular imagery that reveals stress, growth stages, and irrigation problems...
- Verification: Analyzed and compiled by FreeSky GeoData editorial monitoring desk.
A generation ago, satellite imagery was expensive, infrequent, and reserved for governments and large companies. Today, open Earth observation programmes publish fresh imagery of every farm on Earth every few days, free of charge, and a laptop with a free GIS tool is enough to turn that imagery into practical advice about crops. For small farms, cooperatives, and agricultural researchers, this is one of the most useful free datasets available, because it shows problems early, covers fields too large to walk daily, and creates a season-long record of how each field performed.
The workhorse for agriculture is the European Copernicus Sentinel-2 mission, which photographs the Earth in thirteen spectral bands, including red, near-infrared, and shortwave infrared, at ten to twenty metre resolution, and revisits each location roughly every five days. Its red and near-infrared bands are the raw material for vegetation indices, the simple ratios that turn raw imagery into a map of plant vigour. Landsat, run by the United States, offers a longer archive going back decades at thirty metre resolution, which is ideal for comparing this season with previous years.
Both programmes publish their data through free portals, and both can be browsed without downloading huge files, thanks to cloud-based viewers that let you preview imagery before committing to a download. For a single farm, Sentinel-2 is usually the better starting point because of its finer resolution and more frequent revisits. For regional studies or historical comparison, Landsat's archive is unmatched, and combining the two gives both detail and depth.
The most widely used index is NDVI, the normalised difference vegetation index, which compares near-infrared light, which healthy leaves reflect strongly, with red light, which they absorb. The result is a number between minus one and one for every pixel, where high values mean dense healthy vegetation and low values mean bare soil, stressed plants, or water. Free GIS tools and browser-based viewers can compute NDVI from Sentinel-2 or Landsat imagery in a few clicks, producing a colour-coded map where a struggling patch of crop shows up as a dull area among healthy green.
NDVI has limits worth knowing. It saturates in very dense canopies, so it distinguishes a stressed field from a healthy one better than it ranks two healthy fields. It is also sensitive to soil background early in the season, when plants are small and bare earth dominates the pixel. More advanced indices use additional bands to correct for soil and atmosphere, but for routine monitoring, a time series of NDVI maps, one per satellite pass, is usually enough to spot irrigation failures, pest outbreaks, and nutrient stress weeks before a walk-through would.
Start before planting by downloading or previewing one clear image of your fields and drawing field boundaries in a free GIS tool, so every later image can be clipped to exactly the area you care about. Then, once every satellite pass, generate an NDVI map and compare it with the previous pass rather than judging a single image in isolation, because change over time is more informative than any one snapshot. Note the dates of planting, irrigation, and fertiliser applications alongside the imagery, since a sudden NDVI jump after irrigation is expected, while a drop without explanation deserves a field visit.
At harvest, archive the season's imagery and indices together with your yield records. Over two or three seasons, that archive becomes a powerful planning tool: you can see which parts of each field consistently underperform, test whether a change in irrigation or fertiliser actually improved those areas, and show a lender or buyer evidence of how the farm was managed. All of it starts with free data, a free tool, and the habit of looking at your fields from above once a week.
📖 Continue Reading the Full Story
Continue reading this article on FreeSky GeoData.
⚡ Access Full Content NowMore from FreeSky GeoData

 ☁️ FreeSky Cloud
Best Free Tier Cloud Hosting 2026: Host Projects Without Paying
Compare the best free tier cloud hosting options for 2026, including what is genuinely free, what limits apply...
 🤖 WinBar AI
AI Image Generator: Create Art From Text Free
Generate stunning images from text descriptions with free AI. No design skills needed — describe it, get it....
 🛰️ FreeSky Aerial
Troubleshooting Guide: Freelancer Net Pay Calculator (PKR) — Upwork, Fiverr & Payoneer Fees (Day 12 Guide)
Diagnosing hidden issues using the Freelancer Net Pay Calculator (PKR) — Upwork, Fiverr & Payoneer Fees on Fre...
 🔭 FreeSky Cosmos
How to See Planets Tonight Without a Telescope: A Naked-Eye Guide
Five planets are visible without any equipment if you know where and when to look — here's how to find each on...