Sentinel-2 vs Landsat: Which Satellite Data Should You Use?
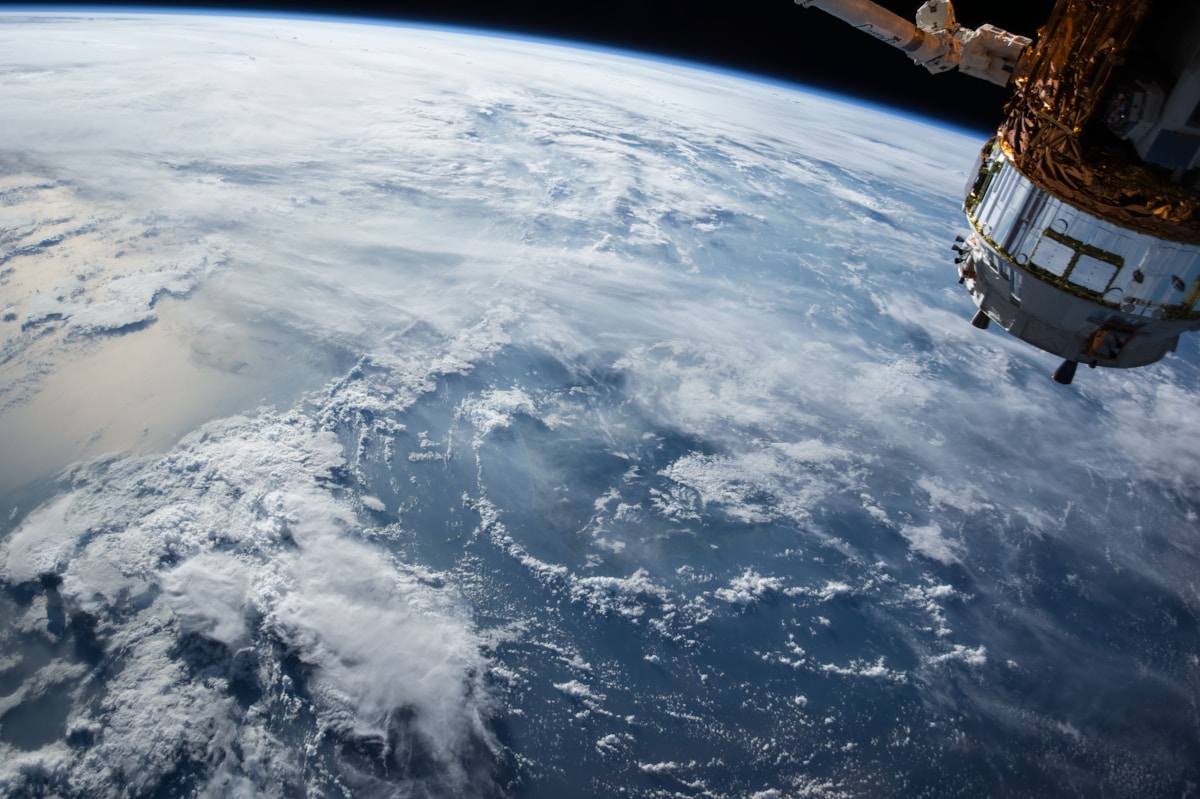
- Primary Signal: Sentinel-2 vs Landsat: Which Satellite Data Should You Use?
- Overview: Sentinel-2 offers finer detail and frequent revisits; Landsat offers decades of history. Here is how to choose the right free satellite data for your mapping project....
- Verification: Analyzed and compiled by FreeSky GeoData editorial monitoring desk.
Sentinel-2 and Landsat are the two most widely used free satellite programs for Earth observation, and choosing between them depends on what you need: finer detail, more frequent images, longer history, or specific spectral bands. Both provide multispectral imagery that lets you study vegetation, water, urban growth, and land change, but they differ in resolution, revisit time, and archive depth in ways that matter for real projects.
Sentinel-2, operated by the European Space Agency, offers 10-metre resolution in its visible and near-infrared bands, with additional bands at 20 and 60 metres. It revisits most places every five days when both Sentinel-2 satellites are combined, making it excellent for monitoring crops, forests, and rapid change. Landsat, operated by NASA and USGS, offers 30-metre resolution for most bands, with a 16-day revisit per satellite, but two Landsat satellites together shorten that interval.
For detailed mapping of small fields, urban features, or river banks, Sentinel-2's 10-metre detail is a clear advantage. For regional studies, long-term trends, or work in areas where 30 metres is sufficient, Landsat's resolution is often perfectly adequate, and its simpler band structure can make analysis easier for beginners. Neither is universally better; the right choice follows the scale of your question.
Landsat's greatest strength is history. Its archive stretches back to the 1970s, allowing researchers to track deforestation, glacier retreat, urban expansion, and coastline change over decades. Sentinel-2, launched in 2015, offers a shorter but denser record, with more frequent images and additional red-edge bands that are especially useful for vegetation health and crop type mapping.
Both datasets are free and available through platforms such as Copernicus Open Access Hub, USGS EarthExplorer, and cloud services that let you process imagery without downloading huge files. In QGIS, you can preview and download scenes, or use plugins and cloud APIs to work with larger areas. Whichever source you choose, check cloud cover, because optical satellites cannot see through clouds, and a cloudy scene may be useless even if its date is perfect.
Choose Sentinel-2 when you need frequent updates, finer detail, or vegetation-specific bands, such as for precision agriculture or forest monitoring. Choose Landsat when you need a long time series, consistent historical comparison, or thermal bands for surface temperature studies. For many projects, the best approach is to use both: Landsat for the long view, Sentinel-2 for recent detail, and a consistent method for comparing them.
Whichever you pick, document your choice: sensor, date, band combination, and cloud cover. That record makes your work reproducible, lets others check your results, and helps you avoid comparing images that differ in season, sensor, or processing. Good satellite analysis is as much about careful documentation as it is about striking imagery.
Many researchers combine Sentinel-2 and Landsat by harmonising their bands and resolutions, creating a denser time series than either sensor alone. This requires care: bands do not match exactly, and atmospheric correction methods differ, so harmonised products use calibration to align them. For beginners, a simpler approach is to use one sensor per analysis period and note the sensor change in your methods, rather than mixing sensors without adjustment.
Cloud platforms such as Google Earth Engine, Microsoft Planetary Computer, and Copernicus Browser make combined use easier by providing analysis-ready data and code examples. Start with a small area and a short time period, verify results visually, and only then scale up to larger areas or longer series.
In the end, the best satellite data is the data that answers your question clearly and reproducibly. Start with the sensor that fits your scale and time period, document your choice, and let the analysis, not the sensor brand, drive your conclusions.
📖 Continue Reading the Full Story
Continue reading this article on FreeSky GeoData.
⚡ Access Full Content NowMore from FreeSky GeoData

 🤖 WinBar AI
AI Phone Support vs Hiring Agents: What Should Betting Platforms Budget?
Hire agents, pay an answering service, or use AI voice agents? Honest costs and tradeoffs for betting platform...
 ☁️ FreeSky Cloud
Should Your SaaS Company Use an AI Receptionist in 2026?
Prospects call when your team is heads-down building. Should your SaaS company let an AI receptionist answer —...
 🌍 FreeSky Remote
When Should You Quit Freelancing and Get a Full-Time Job?
Freelancing is not for everyone, and quitting it is not failure. These are the honest signals that a full-time...
 ⚡ CyberTech 568
Best Free AI Voice Changer for Gaming in 2026
A good voice changer adds fun to game night without lag or robotic audio. Compare the best free options for Di...